Showing posts with label new maps of damage. Show all posts

Monday, June 1, 2015

Prayers and Lessons


The massive multistate flooding in the southern plains states in late May 2015 actually approaches the magnitude of the multistate Great Easter 1913 Flood in some ways. Message: Extreme, widespread, non-hurricane rain events in the middle of the nation can happen again. Are we ready?

The epic flooding across Texas still ongoing strikes personal alarm in my heart: my sister and nephew live in a suburb of Dallas. 

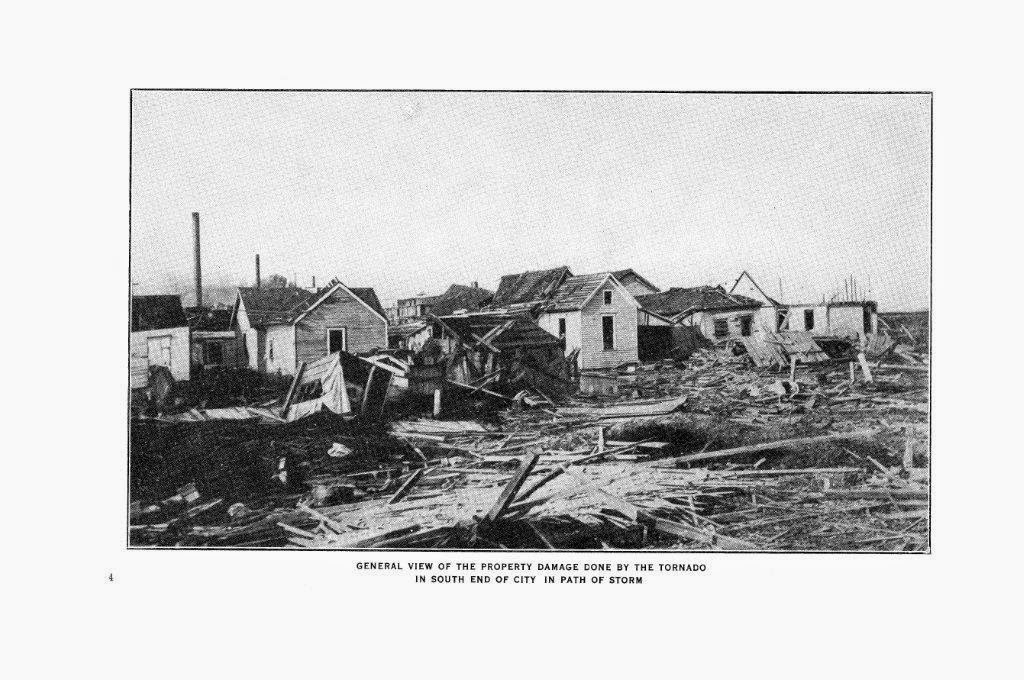
Flash floods can be as damaging as tornadoes, as evidenced by the smashed ruins of a home on the Blanco River after heavy rains caused flash flooding in Wimberley, Texas, May 24, 2015. Credit: Rodolfo Gonzalez/AP

But just because Houston, Dallas, Austin, Corpus Christi, Brownsville, and other Texas major metropolitan areas have riveted the public eye, let us not forget that also hammered were Oklahoma (my sister’s in-laws live near Oklahoma City), Louisiana, Arkansas, Missouri—and even Kansas and Nebraska. Yet, just in the way the news focuses on Texas, one can see the forgetting is already setting in.
Radar mosaic of storm system marching across Texas and Oklahoma, May 24, 2015, causing multistate flooding. Credit: National Weather Service 
In fact, I’m willing to wager that this 2015 multistate natural disaster will be remembered as something like the Great Texas Flood, or worse, the Great Houston Flood—thereby diminishing its significance to history—instead of with a name befitting its scale, such as, say, the Great Memorial Day 2015 Flood. And with a diminished name comes forgetting. After all, we’ve seen it all before: in what has been handed down to us with a name diminished to be one city’s flood—the Great Dayton Flood—instead of the Great Easter 1913 Flood, so vast that it engulfed more than a quarter of the nation, and yet has been virtually forgotten.  
Left: Rescue personnel grab the hand of a man stranded in rushing water at the northwest corner of Lamar Blvd. and 15th St. in Austin, Texas. Shoal Creek overflowed its banks and inundated the major traffic artery with rushing water. Several cars were stalled under and near the 15th St. Bridge on Monday, May 25, 2015. Credit: Alberto Martinez/Austin American-Statesman via AP 
Right: After floodwaters had receded perhaps six feet at Burns Avenue and Catherine Street south of downtown Dayton, Ohio, stranded people could be rescued in one of the National Cash Register flat-bottomed boats. Note the dark staining on the sides of the brick buildings showing peak flood height. Credit: Dayton Metro Library
Despite differences in the regions and eras, the tragedy playing out in the southern plains states right now bears such striking parallels to what happened across the Midwestern, eastern, and northern plains states a century ago that a few comparisons are instructional. Moreover, the comparisons point up two additional, chilling cautionary messages for our future.

Side by side
Below are selected photographs of the severe flooding across the southern plains states in 2015, paired with similar photos from various states from the Great Easter 1913 flood. For all images, all rights remain with the original photographers and news organizations credited in the captions.
Incredible lightning strike seen in Kyle, Texas, on Monday, May 25, 2015. Credit: Twitter/@marteenee13 and @WarrenHughes13
First striking parallel: the storm system itself. In neither case was the flooding due to a hurricane or storm surge. In both cases, flooding was due to long-duration, intense rainfall from a monumental, slow-moving storm system featuring repeated lows following one right after another, concentrated over a region already saturated from previous intense rainfall so runoff was exceptionally high (for 1913, see “Be Very Afraid”; for 2015 see Weather. com). In both cases, the storm was accompanied by violent lightning (see image 4 at here) and tornadoes (for 1913 see “’My Conception of Hell’” and “Terror at Terre Haute”; for 2015 see Wikipedia.
Left: Woman climbing through the ruins of her tornado destroyed house in Oklahoma. Credit: NBC News. Right: Woman surveys ruins of a home destroyed by the Great Easter 1913 Omaha tornado. Credit: Omaha Public Library 
In both cases, rivers rose rapidly and descended on communities as veritable walls of water, even in regions not normally prone to flooding. Such flash flooding has the violence of tornadoes (see "An Unnecessary Tragedy").
Left: The level of the Blanco River at Wimberley soared from 5 feet on Saturday afternoon, May 23, to a record 40.21 feet at 1:01 am CDT Sunday, more than 7 feet above the prior record. The river gauge stopped reporting after this point. Credit: NWS Advanced Hydrologic Prediction Service. Right: The fast-rising Muskingum River at Zanesville, Ohio, in 1913 also wiped out the weather gauges, and also crested at nearly 52 feet (vertical line in the middle of the chart) – 15 feet higher than a previous record set by a flood 20 years earlier. Credit: NWS 
But here’s a big difference between the two storm systems. Communications still functioned in 2015 and warnings were issued and heeded, so “only” 28 lives were lost—actually, likely 28 and counting as more bodies turn up and as people injured during the violence of flash flooding perish from complications of their injuries. In 1913, the death count—over 600 in Ohio and Indiana alone—was much higher because the massive windstorm on Good Friday, March 21 severely crippled communications so that weather data could not be gathered nor warnings issued (see “The First Punch”). Moreover, some of the flash flooding occurred in the dark of night, sweeping away people in their homes with no warning (see “’Death Rode Ruthless…’”).
Left: In this aerial photo, water from the Arkansas River floods a farm shed in Faulkner County near Conway, Ark., Friday, May 29, 2015. Credit: Danny Johnston/AP.  Right: Dayton homes were submerged to their eaves in the Great Easter 1913 Flood. Credit: Dayton Metro
In both calamities, homes and buildings drowned, the floodwaters reaching midway up the first story or even to the eaves. Note the sheen of oil on the floodwaters surrounding the half-submerged farm building photographed in 2015. That points out a serious hazard of severe floods today—the fact that they can breach stores of chemicals and toxic waste dumps, so the chemical-laden floodwaters are themselves toxic (see “Benchmarking 'Extreme'”) Indeed, in Houston, 100,000 gallons of untreated wastewater and raw sewage spilled into the floodwaters when the Southwest Wastewater Treatment Plant was flooded. But perhaps that was no different than conditions during the 1913 flood when the human excrement from the vaults of thousands of outdoor privies (outhouses) contaminated the floodwaters.
More than 100,000 gallons of untreated wastewater has spilled after Houston's Southwest Wastewater Treatment Plant flooded Tuesday when a bayou overflowed its banks. Credit: Before It’s New
By the way, don’t be surprised if the flooding in the southern plains states also causes fires due to electrical shorts and broken gas mains—it happened in Dayton, Ohio, and Troy, New York, in 1913 and also after Hurricane Katrina in 2005 (see “Like a War Zone”) .
Left: Flooding in Norman, Oklahoma, on Saturday, May 23, 2015. Credit: StevenAnderson. Right: 1913 flooding photographed in Hamilton, Ohio. Credit: Michael J. Colligan History Project
In both 2015 and 1913, flooding brought transportation to a standstill, by flooding roads and streets, stranding vehicles, and destroying bridges. In 1913, railroads were also crippled as sections of track were washed away.
Floodwaters in May 2015 swept away an entire bridge in Wimberley, Texas. Credit: Twitter/@bez2012 Fifth Street Bridge over the Great Miami River in Dayton was completely destroyed in by the Great Easter 1913 Flood. Credit: Miami Conservancy District.
Altogether, rainfall for May 2015 in Oklahoma and Texas blasted through previous records, with totals exceeding two feet in that single month in Norman and between 18 to 24 inches widespread elsewhere. For perspective, that approaches triple the average winter monthly rainfall in Olympia, Washington, in the Pacific Northwest rain forest (about 8 inches per month). Indeed, in Houston and elsewhere, rain fell at a rate of more than 4 inches per day. A few places received rain at a rate of up to four inches per hour for short stints.

Some wag at the Fort Worth National Weather Service calculated that the rain that fell on Texas during the month of May amounted to more than 35 trillion gallons, enough to cover the entire state 8 inches deep. 

For comparison, in 1913, W. J. Cox, head of the Pittsburgh weather bureau, calculated that an average of 6.26 inches inundated the combined area of Ohio and Indiana in just four days  , amounting to close to 1.1 trillion cubic feet; at 7.48 gallons per cubic foot, that would come to about 8.2 trillion gallons. 

Actually, two years ago, Sarah Jamison, senior hydrologist at the Cleveland National Weather Service, recalculated that that 8 trillion gallons was runoff, produced by closer to 12 trillion gallons of actual rainfall. Yes, 12 trillion gallons is only a third of 35+ trillion gallons, but Ohio and Indiana together also have less than a third of Texas’s area (1/3.6 to be exact). More importantly: the 1913 calculations are for just four days, whereas the Texas ones are for the entire month. A more direct comparison would be the intensest four-day period over the southern plains states. And of course, for full storm volume, one really needs to add in the rainfall totals over all the other states deluged in both floods.

Two chilling cautionary messages
Still, at first glance, the rainfall totals point up an astounding revelation: the Great Memorial Day 2015 flood in the southern plains states likely approaches the magnitude of the Great Easter 1913 Flood for both intensity and multistate  
Left: May 2015 shattered rainfall records across both Texas and Oklahoma for the entire month of May—over 2 feet in some places. Credit: Weather. com  Right: modern reconstruction of rainfall across Indiana and Ohio for just "flood week" March 23–28, 1913. Credit: Midwest Regional Climate Center 
area—especially monumental as both natural disasters were due to rainfall alone, not to a hurricane (the heaviest rainfall ever in the U.S. was 43 inches in 24 hours, also in Texas, but during a hurricane).

The Great Memorial Day Flood of 2015 was a multistate event comparable in certain ways to the Great Easter Flood of 1913. Here they are shown side by side roughly to scale. Each deluge exceeded the other in some ways, but both were notable in being extreme non-hurricane rain events. Southern plains states map: USA Today; U.S. map with 1913 contours and tornadoes: ©2008 Trudy E. Bell
Let’s explore this 2015-1913 comparison a little further. In the southern plains, four inches per day comes to a foot in three or four days, comparable to the 11+ inches in four days in the most intense part of the 1913 flood over Ohio’s continental divide. Texas’s and Oklahoma’s overall monthly rainfall far exceeded any monthly total Ohio has ever experienced. 

In short, had the southern plains rain fallen over the same wide geography as the Great Easter 1913 Flood centered on Ohio’s continental divide, no question it would have precipitated a comparable repeat of that disaster. That is relevant because several recent (2012–2014) reports have cautioned that intense rain events are likely to increase both locally and regionally (see “Benchmarking 'Extreme'”).
In both floods, human beings were not the only victims. In 1913, thousands of horses, cattle, other livestock, and countless wildlife succumbed. In 2015, livestock, deer and alligators are in danger (see Click2Houston and the above Reuters video) while scores of pet animals are separated from their owners.
Moreover, if 1913 is any guide for today, recovery will be a long, tough slog. Texas, Oklahoma, Arkansas, Louisiana, Kansas, and elsewhere will not return back to normal as soon as the waters recede. The severe damage to infrastructure and homes will require months, if not years, for recovery. 

Moreover, today as in 1913, most people do not have flood insurance: normal homeowners’ policies do NOT insure against flood or groundwater. Flood insurance is required only in those areas designated as flood zones. As many 
8 Left: Rising floodwaters at Shoal Creek are shown after days of heavy rain on May 25, 2015 in Austin, Texas. Credit: Drew Anthony Smith/Getty Images. Right: Water rushing against the arches of the Court Street Bridge in Rochester, New York, in March 1913. Credit: Monovisions 
areas in Texas and Oklahoma that flooded were not in designated flood zones, most of those residents likely did not have policies. In other words, the destruction of their homes and all their contents and life's savings is a dead loss. 

Last: one unpleasant surprise from 1913 was: areas flooded that were not supposed to flood. The lesson from 2015 for the future is: how true that still can be.
My fervent thoughts and prayers go out to all the flood sufferers, with hopes that aid pours into them as it did to those in 1913.

©2015 Trudy E. Bell

Next time: Never Before Seen

Selected References
For discussion about the 1913 flood losses being especially severe because areas flooded that were not normally prone to flooding, see A. H. Horton and H. J. Jackson, The Ohio Valley Flood of March–April 1913, Water Supply Paper 334, U.S. Geological Survey, Government Printing Office, Washington, D.C., 1918, especially pages 45 and 85.
Bell, Trudy E., The Great Dayton Flood of 1913, Arcadia Publishing, 2008. Picture book of nearly 200 images of the flood in Dayton, rescue efforts, recovery, and the construction of the Miami Conservancy District dry dams for flood control, including several pictures of Cox. (Author’s shameless marketing plug: Copies are available directly from me for the cover price of $21.99 plus $4.00 shipping, complete with inscription of your choice; for details, e-mail me), or order from the publisher.

Friday, May 1, 2015

Terror in Terre Haute


The violent tornado that ripped through southern Terre Haute, Indiana, on Easter night, March 23,1913, may have been more than one twister, and its full path of destruction extended over 25 miles

Lightning crashes repeatedly, luridly lighting the parlor where John Hanley and his family were trying their best to ignore the violent thunderstorm and enjoy being together the rainy night of Easter Sunday 1913. Then around 9:45 PM, over booming thunder and howling winds and drumming rain, Hanley hears a growing roar of what 
Oil painting, possibly of the Terre Haute tornado, was featured as the cover of a leaflet by the New York Underwriters Agency advertising tornado insurance. The unidentified location may have been of a rural area southwest or northeast of Terre Haute itself. If so, artistic license is liberal. The actual tornado struck not in sunlight but well after dark—nearly 10 PM Easter night—in the midst of horrific lightning and torrential downpour, and very likely people were not running across farm fields so near it. Credit: Ray Thomas collection of postcards on the 1913 flood 
sounds like a fast-approaching express train. He opens the front door—and beholds a towering tornado just blocks away, bearing down in his direction and sweeping up whole houses in its fury.


No time to run for the storm cellar—. Yelling he knows not what, Hanley gathers his family around him in the small hall to huddle behind the strong front door and its protective outer storm door. Seconds later, heavy timbers fly through the parlor window and across the room in a cascade of shattering glass. In moments, the beautiful home is wrecked, along with Hanley’s three-story warehouse of awnings and construction materials behind it. Had the family remained seated in the parlor, all five would have been killed.

The destroyed Hanley house likely looked something like the Dix house, shown here, the morning after the tornado roared through Terre Haute. Credit: Terre Haute’s Tornado and Flood Disaster, Wabash Valley Visions and Voices
In less than two minutes, the tornado roars across southern Terre Haute, Indiana, destroying some 250 homes, ruining businesses and livelihoods, and killing a score of friends and neighbors and maiming hundreds more. Along the path of destruction—which varies from 100 to 500 yards wide—fires ignite as crossed electrical wires short, gas lines burst, and glowing coals from overturned kitchen and bedroom stoves that cold  night scatter onto carpets, bedding, and curtains. Through the torrential downpour falling on the ruins of human lives rise wails of agony and mourning. 

Wide-angle view of a few blocks of destruction a day or so after the Terre Haute tornado. Note that many people had umbrellas, as heavy rains were continuing, and in the next day or two flooding was widespread. Credit: New York Underwriters Agency advertising leaflet in Ray Thomas collection of postcards on the 1913 flood 
 
Reconstructing Terre Haute’s disaster
One long-standing mystery to me has been the fact that today the Terre Haute tornado is remembered just for striking one portion of one city, as if it touched down there and nowhere else. Moreover, text references to it both then and now as “the Terre Haute tornado” imply the assumption that it acted completely alone. Yet, violent tornadoes are more typically part of a larger rotating regional-scale supercell thunderstorm system that tends to generate multiple tornadoes—as indeed happened four hours earlier that same night Easter Sunday, 1913 in Omaha, Council Bluffs, and elsewhere across Nebraska, Iowa, and Missouri (see “‘My Conception of Hell). And as strong vortices, they also tend to persist along paths miles long. 

The Terre Haute tornado destroyed the factory buildings of the Root Glass Works, but did not destroy the company itself, which two years later (1915) went on to design and patent the iconic Coca Cola bottle, this year celebrating its centennial. Credit: Engineering News
So for years, my big questions were: did the Terre Haute tornado indeed act alone? And what was the full extent of its path of destruction? To research those questions, a year ago (April 2014), I photocopied articles on the Terre Haute tornado from microfilmed pages of 10 local 1913 newspapers in Vigo and surrounding counties housed at the Indiana State Library in Indianapolis.

The path of the Terre Haute tornado never was mapped either at the time or later—or if it was, such a map seems never to have been published in local newspapers or in Monthly Weather Review, the official journal of the U.S. Weather Bureau. But the commemorative booklet Terre Haute’s Tornado and Flood Disaster, March twenty-three to thirtieth, nineteen hundred and thirteen issued by the Terre Haute Publishing Co. and heavily relying on newspaper accounts and photographs, compiled many individual stories—many of which include names and street addresses of victims and of buildings destroyed.

Cover of the commemorative booklet Terre Haute’s Tornado and Flood Disaster, March twenty-three to thirtieth, nineteen hundred and thirteen issued by the Terre Haute Publishing Co. Street addresses in this booklet allowed me to plot the destruction of the tornado through Terre Haute. Credit: Wabash Valley Visions and Voices


So with the aid of Google Maps, I spent an entire day plotting scores of 1913 addresses on a modern map of Terre Haute to see what emerged.

Map of the southern half of today’s city of Terre Haute, plotting the location of damage by address given in the 1913 commemorative booklet Terre Haute’s Tornado and Flood Disaster. Credit: base map Google Maps; 1913 tornado damage plot Trudy E. Bell
 
Several revelations emerged. First, the city of Terre Haute in 1910 was Boomtown, USA. It had almost the same population as it does today: over 58,000 compared to 61,000, making it then one of the nation’s top 100 populous cities. It was also growing fast, Even so, its city limits were smaller and surrounded by fields and farmland instead of urban sprawl and suburbs (today Terre Haute’s entire statistical metropolitan area encompasses over 170,000 people). 

Second, street numbering and names today must differ on some streets. Google Maps could not plot any of the addresses in the booklet given for Lockport Road, so those data are missing from my map. Neighborhoods must have also changed names. For example, the booklet states that tornado damage was particularly bad in Krumbhaar Place, “the new sub-division recently opened on the south side of the city”; I could find no subdivision with that name today, just a single Krumbhaar Street in what might be the approximate area. Another hard-hit area I could not find was Gardentown (also spelled Garden Town), apparently an unincorporated community six or eight miles south of the city just north of Prairieton and largely devoted to truck farming for fruit and vegetables and greenhouses for florists. Appeal to readers: If you know more about the historical geography of Terre Haute, please contact me.

Another general view of tornado destruction in the Terre Haute. Credit: Terre Haute’s Tornado and Flood Disaster, Wabash Valley Visions and Voices

Third, it is clear from the booklet’s text that several newspaper reporters or other authors sought to be as thorough as possible, clearly visiting hospitals and walking along ruined streets. But the accounts are jumpy in geography and some of the anonymous writers were more complete than others in specifying locations.

Nonetheless, the map I was able to construct of the tornado’s path of destruction through Terre Haute reveals tantalizing structure. Are the variations in width due to actual variation in width of the tornado’s funnel of destruction, or merely incompleteness or limitations in data gathered or published? Do separations in areas of destruction reveal that the tornado hopped along its path, or did it just pass through what were open fields in 1913 until encountering another group of buildings?

And could it have been a multiple-vortex tornado with several small, short-lived smaller subvortices that orbit around the main funnel: subvortices that actually deal some of the worst death and destruction? 

Multiple-vortex tornado with half a dozen small, short-lived, but exceptionally violent subvortices, photographed near Altus, OK on May 11, 1982. Credit: U.S. National Oceanic and Atmospheric Administration (NOAA)
 
A 2013 article by Mike McCormick for the Terre Haute Tribune-Star written for the centennial of the Terre Haute tornado describes it as a “multi-funneled tornado” shortly before 11 PM. But the article cites no reference for either the time—which is clearly documented as 9:45 PM in Monthly Weather Review and elsewhere—or the assertion about multiple funnels. 

McCormick also writes that “According to several witnesses, the storm cloud divided. One section, containing two shafts [sic], headed east between Hulman and Washington streets. The other went northeast, killing Dr. Mahlon Moore at his office at 629 College Ave.” I plotted McCormick’s locations on my map in blue (to distinguish them from the locations cited in the booklet). However, I have not yet found any 1913 primary source for his statements, although the commemorative booklet does show a photograph of Moore’s devastated office (with no address). 

Ruins of office of Dr. Mahlon Moore; if the address given by Mike McCormick is correct, might Moore have been killed by a subvortex? Credit: Credit: Terre Haute’s Tornado and Flood Disaster, Wabash Valley Visions and Voices 
But if McCormick is right about the location of Moore’s office, that would be strong evidence for another vortex some distance from the main funnel. Moreover, I wonder whether the patches isolated damage removed from the main path of my map suggests the possibility of damage from subvortices, which last only a few seconds but are exceptionally destructive.


The map of the destruction I compiled from the booklet, plus the booklet’s stated variations in the width of destruction, is tantalizingly suggestive of the cycloidal marks carved into farm fields from multiple-vortex tornadoes.  

Cycloidal marks in farm fields left by a multiple-vortex tornado. Credit: U.S. National Oceanic and Atmospheric Administration (NOAA)
25+mile path
Both the booklet and local newspapers published immediately afterwards in and around Vigo County and in Indianapolis clearly describe additional tornado destruction in and north of Prairieton—a town of about 700 population 8 to 10 miles southwest of Terre Haute. The Brazil Daily Times and The Crawfordsville Journal also detailed damage in Perth, an even smaller town (400 population) about 20 miles northeast of Terre Haute, as well as in Glenn and East Glenn, the western part of Seelyville, and Ehrmandale in between. The northeasternmost report of damage was a mile and a half west of Carbon. 

Plotting those areas on a broader-area map suggests that the path of the Terre Haute tornado could have been 25 to 30 miles long, as the paths line up nicely. There is also the possibility of the three areas of destruction being wreaked by different twisters, but almost no newspaper accounts indicate the time locations were hit, which would be essential in sorting out the truth. 

Map of tornado damage in various locations reported in half a dozen local newspapers reveals that the path of the Terre Haute tornado was at least 25 miles long. Credit: base map Google Maps; 1913 tornado damage plot Trudy E. Bell
Plotting specific locations on the streets of Prairieton, Seelyville, and Perth was almost impossible: in such small communities, clearly everyone knew everyone else and local landmarks, so destruction is described only by giving the owners’ names without street addresses or just the names of local parks long gone. That makes it almost impossible for someone a century later without detailed knowledge of local history or access to public records of property ownership to map the extent of damage. Again, I welcome contact from any reader who can help.

Why was more information not preserved about the path and timing of the Terre Haute tornado? Reporters in Omaha and Council Bluffs and elsewhere did history a huge service in preserving a very detailed and thorough record of the family of 10+ tornadoes that struck Easter night 1913. Why is the record sketchier in Indiana?

Ruins of Olson house. Note umbrellas, as it was raining hard and flooding followed a couple of days later. Credit: Credit: Terre Haute’s Tornado and Flood Disaster, Wabash Valley Visions and Voices

The answer dawned when I was photocopying the newspapers on microfilm in the Indiana State Library: tragically, the city of Terre Haute was unique in suffering both violent tornado damage (like Nebraska, Iowa, and Missouri) and record flooding (like Ohio and other states) in the Great Easter 1913 storm system. Indeed, Indiana, like Ohio, was at the epicenter of the 1913 flood. On Easter Sunday, rain in Terre Haute was already heavy, and floodwaters began overflowing river banks the next day. Not only did record-high floodwaters confront Terre Haute residents with more urgent worries than tracing a tornado’s path through the open countryside, but also nature itself was immediately obliterating that very evidence. 

Death undercount
Published death counts for the Terre Haute tornado range from 17 to 21. Seventeen—the number given in the booklet—is a clear fact-checking error and significant undercount: simply cross-checking the names of fatalities described in the booklet’s text with the names given in “Toll of the Tornado” reveals the omission of at least three people whose bodies were discovered: Mrs. Moses Carter and Mrs. Leonard Sloan and her day-old infant. Also, The Crawfordsville Journal reported “one or more” people killed in Prairieton. So the verified minimum is no fewer than 20 killed, and perhaps closer to 23.

And of course, as discussed already in a detailed analysis of fatalities during the Great Easter 1913 storm system and flood (see “‘Death Rode Ruthless…’” ), people injured by the Terre Haute tornado could have died weeks or even months later of complications and thus not have been counted as tornado deaths at the time the booklet was published.
© 2015 Trudy E. Bell

Next time: Never Before Seen

Selected references
Special thanks go to Ray Thomas for high-resolution scans of the New York Underwriters Agency leaflet and permission to use images from his amazing website of postcards from the 1913 flood

In addition to the sources already cited in the text, these also proved especially useful:

“Big Storm Passes West of Brazil” and “Damage Near Carbon,” both in The Brazil Daily Times, March 25, 1913, p. 1.
Edwards, Roger, “The Online Tornado FAQ,” U.S. National Oceanic and Atmospheric Administration 
 
Grazulis, Thomas P., Significant Tornadoes, 1880-1989. St. Johnsbury, VT: Environmental Films, 1991. Classic and fascinating two-volume reference detailing virtually every U.S. tornado F2 and greater for more than a century. Grazulis now runs The Tornado Project.

“Perth in Path of Disastrous Storm” The Brazil Daily Times, March 24, 1913, p. 1.

Shannon, Charles W., “Soil Survey of Clay, Knox, Sullivan and Vigo Counties, Indiana,” Thirty-Sixth Annual Report of Department of Geology and Natural Resources, Indiana 1911, Indianapolis, 1912, pp. 137–280. Brief description of Garden Town is on page 275.

 “Tornado and Flood Damage at Terre Haute, Ind.,” Engineering News 68(15): 738–739, April 10, 1913.

“Tornado at Terre Haute, Ind., March 23, 1913,” Monthly Weather Review 41(3): 483–484, March 1913.

Bell, Trudy E., The Great Dayton Flood of 1913, Arcadia Publishing, 2008. Picture book of nearly 200 images of the flood in Dayton, rescue efforts, recovery, and the construction of the Miami Conservancy District dry dams for flood control, including several pictures of Cox. (Author’s shameless marketing plug: Copies are available directly from me for the cover price of $21.99 plus $4.00 shipping, complete with inscription of your choice; for details, e-mail me), or order from the publisher.